Solve Wi-Fi Coverage Problems with WiFi Explorer and NetSpot
As someone who has written about Wi-Fi for many years and tested hundreds of pieces of gear, I’m always looking for affordable, useful tools that let me analyze my home network. In the past, companies have loaned me spectrum analyzers, which examine all the radio signals on ranges of frequencies. But while IT professionals may find those useful, they’re overkill for home users and small business: they’re just too expensive.
That’s why I was excited to stumble across the $15 WiFi Explorer. It was first released in 2012, but didn’t appear on my radar until the 2.0 release in May 2015. With a combination of graphic visualizations, lists of information, and the capability to drill down into super-technical details, WiFi Explorer has become my top recommendation for anyone trying to sort out a local Wi-Fi environment.
WiFi Explorer pairs beautifully with NetSpot, an OS X Wi-Fi signal-mapping program I reviewed way back in 2011 for Macworld. NetSpot has matured since then, and does its job even better now, while also adding some serious (and expensive) professional options above the free, non-commercial level.
Let’s start with Netspot, even though we’ll only use a fraction of its power. It’s a great way to get a two-dimensional lay of the land.
Paint a Wi-Fi Picture — Netspot starts with a map. You can import a house or office plan, sketch one, use a sample map, or start with an empty page. You measure the distance between two points you mark on the map and it uses that to scale the rest of the map. Then you wander around your premises with a laptop, clicking to measure at various points.
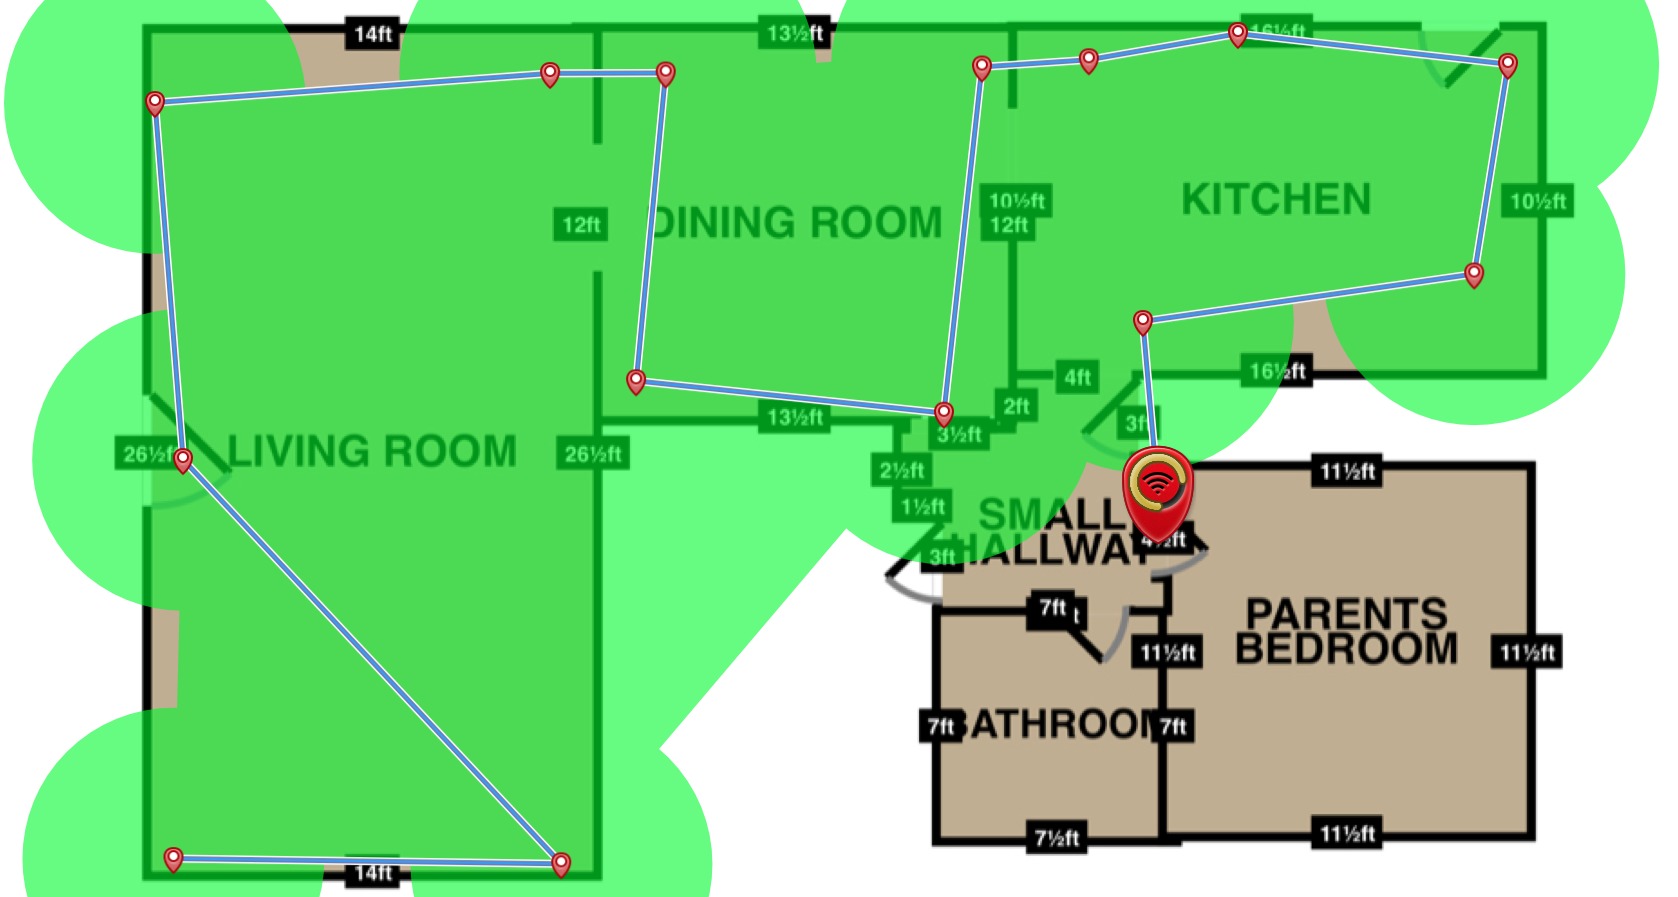
You can mark just a handful of sampling points, but I like to use many for greater insight. Once you’ve finished sampling, you have an interactive map. One of the absolute neatest features of NetSpot, and one reason I was immediately impressed with it originally, is that it can accurately calculate where your access points are located.
In my case, I have an 802.11ac AirPort Extreme on our main floor, and then a single-band-at-a-time 802.11n AirPort Extreme in the basement near my desk. At the other end of the house, in a guest room, I have an 802.11n AirPort Express. The upstairs base station was placed within several inches. The downstairs units, sampled through the floor, were only a few inches further off.
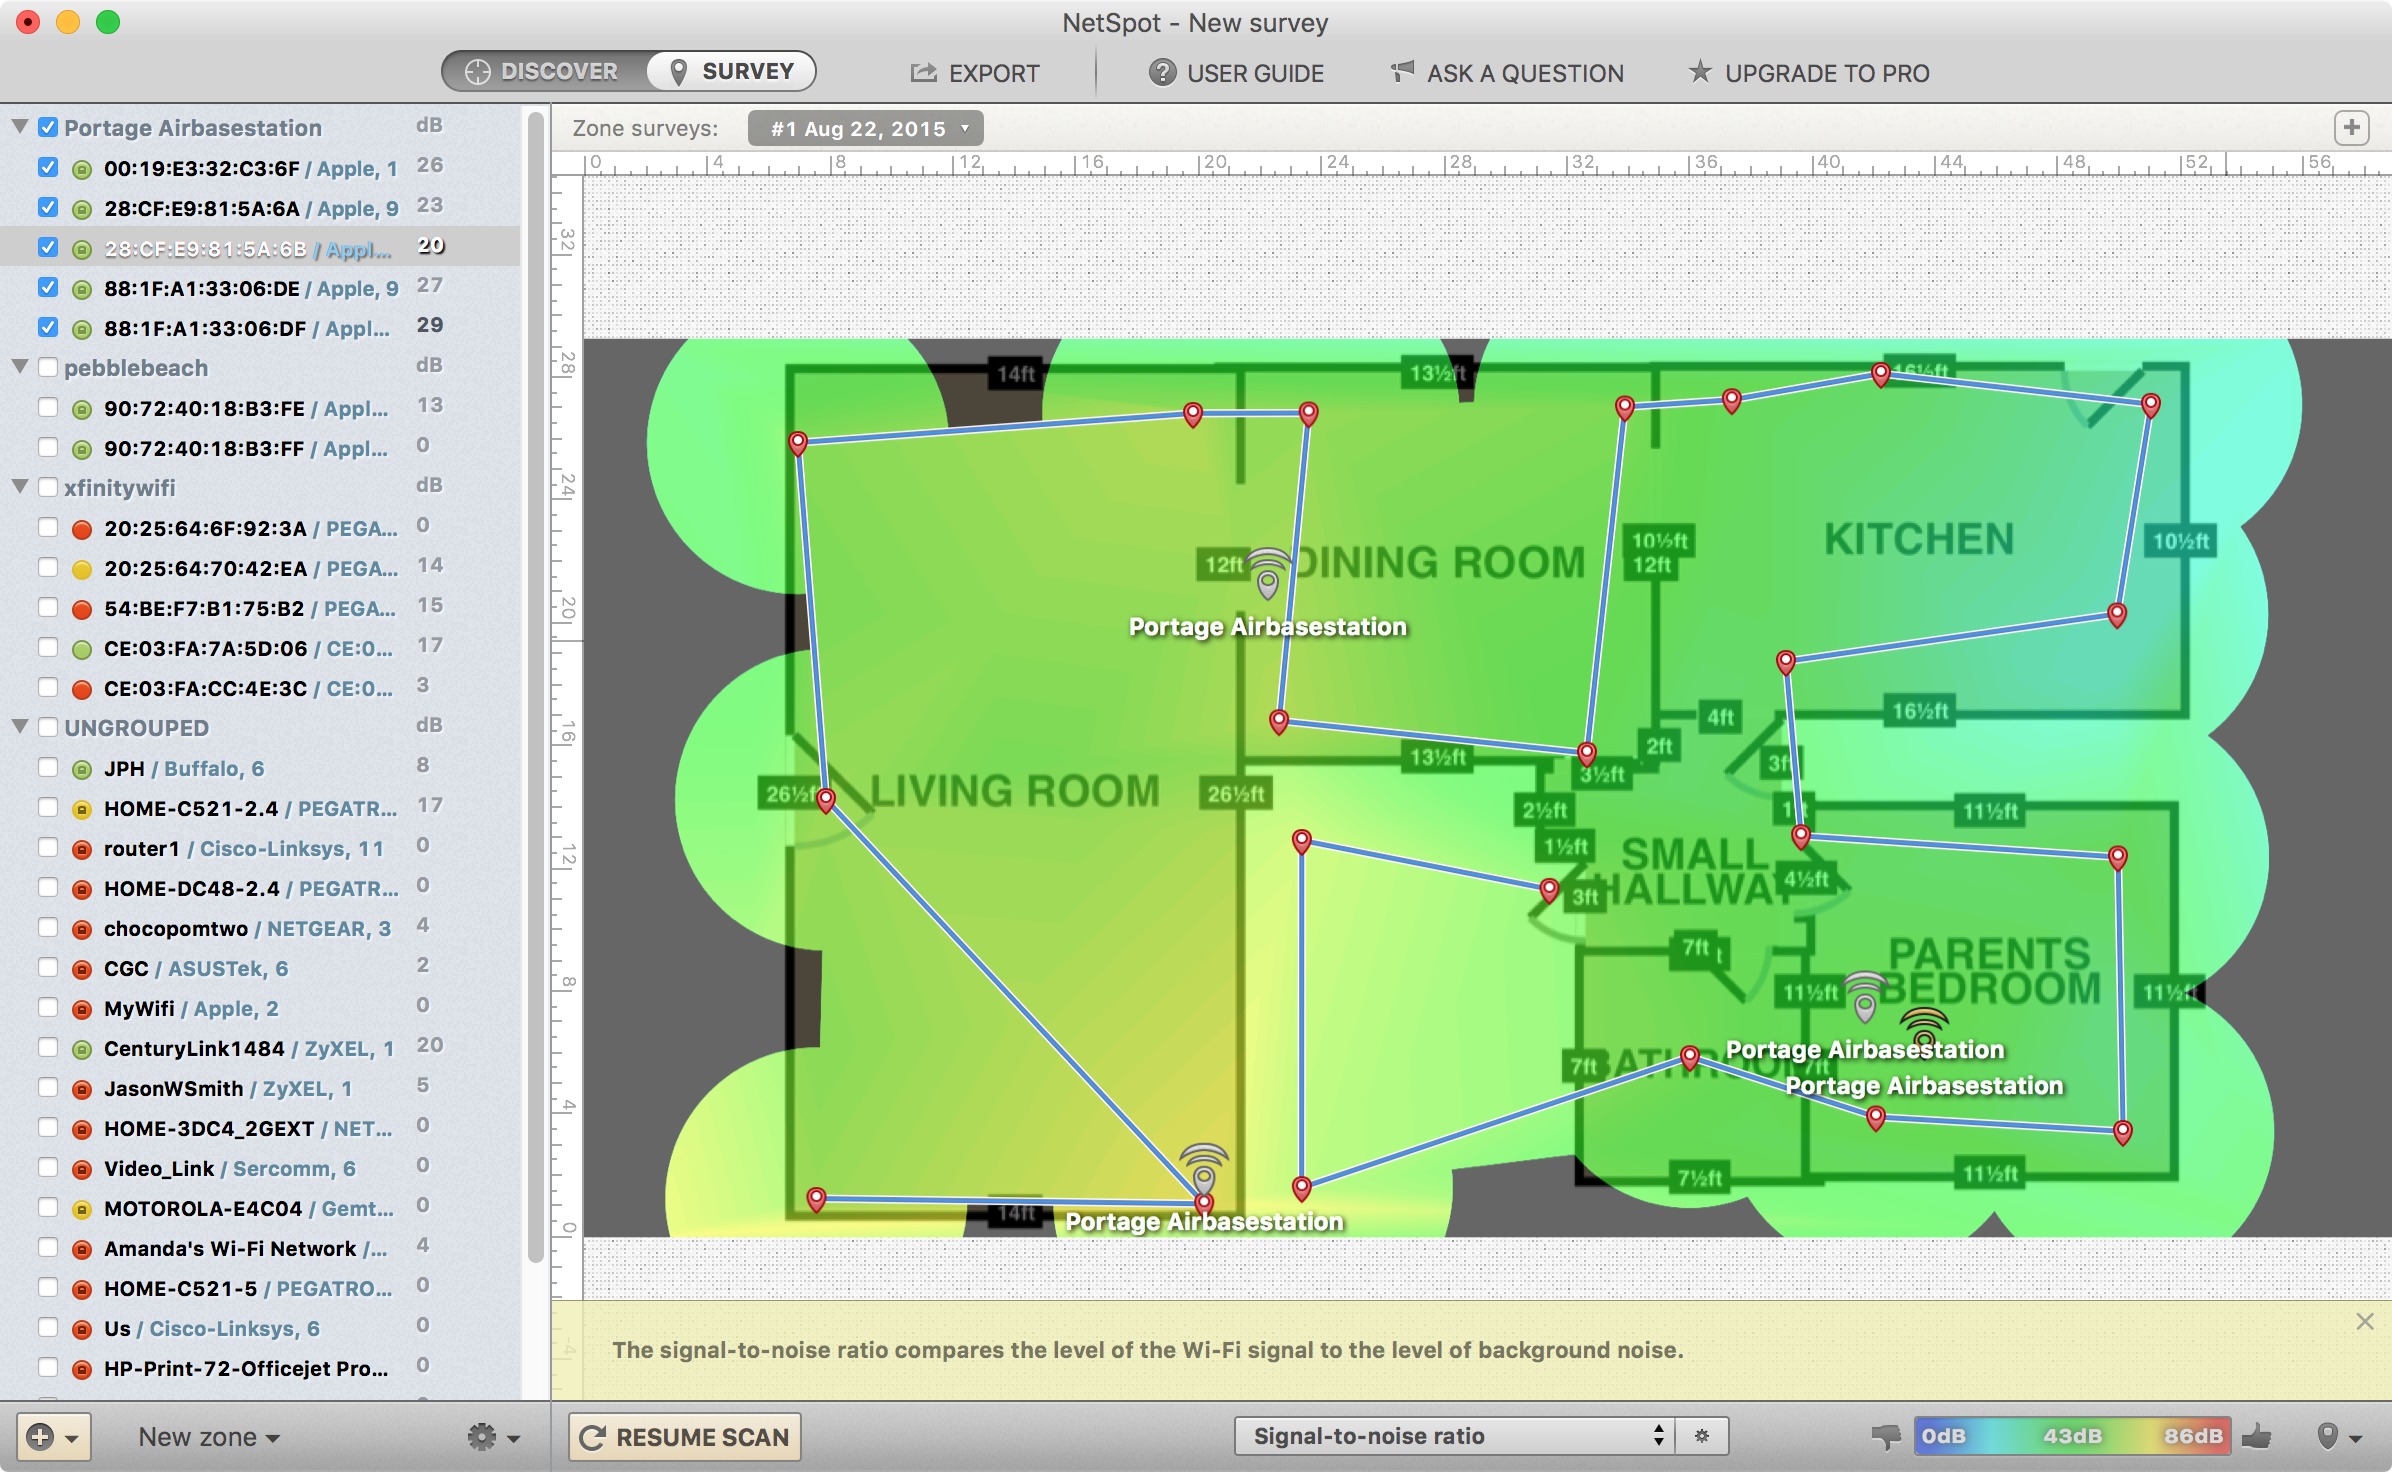
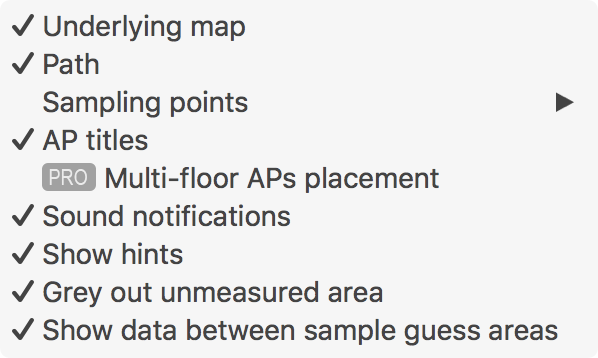
The interactive map lets you select and deselect base stations in a list, so you can see in isolation and together what your best coverage is. As noted in my 2011 review, the spectrum of colors ranges from blue (terrible) through cyan to green (good) through yellow to red (best). This provides a lot of granularity at a glance, but just remember green, yellow, and red are good, better, best. You can also use a pop-up menu to toggle what’s overlaid on the map as a whole.
The free version lets you visualize only up to five access points at a time, which includes each radio on a multi-band router. I have three routers, two of which are simultaneous dual-band models, and thus I was able to see my whole network within the five-unit limit. In addition, the free version is intended for non-commercial use with personal computers.
For offices, Netspot Pro costs $149 for a single-user license, and the 10-user Netspot Enterprise license is $499. These prices are reasonable if you’re maintaining multiple large networks, and you get a lot more features to boot.
Once you have a completed map, print it out to use as a guide, so you can consider improvements while you use WiFi Explorer to measure and analyze both the signals in the air and the radio choices you and your neighbors have made.
Sniff the Air Around You — WiFi Explorer helps tremendously with understanding interference from adjacent networks by providing both comprehensive details and graphical insight. It also lets you see at a glance precisely how your network is configured. Apple doesn’t offer that in AirPort Utility, which shows connections and base station names, but requires you to hover over each base station to see channel assignments and other details.
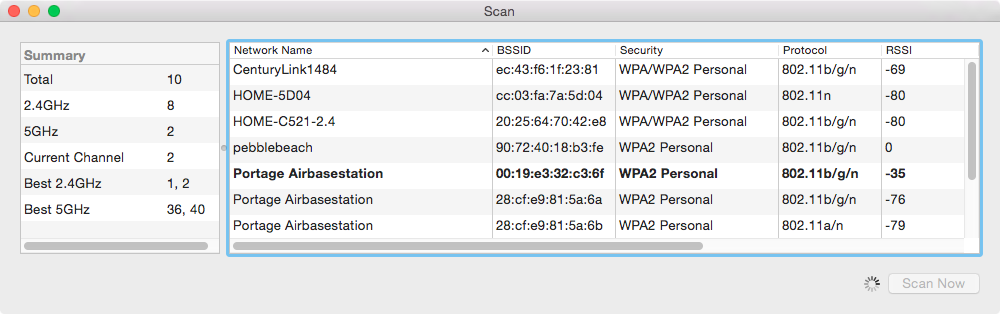
WiFi Explorer has just one window with four views at the bottom, three of them visualizations. When launched, the app starts scanning. If you don’t see updates, make sure the top display says “scanning.” The scan is updated every five seconds. A left navigation bar lets you filter networks discovered in the vicinity by Wi-Fi mode, network name, and other parameters.

The list at top is typical of Wi-Fi scanners, including the one built into OS X. (Hold down the Option key, click the Wi-Fi menu, choose Open Wireless Diagnostics, and choose Scan from the Window menu.)
WiFi Explorer packs a lot of information into a well-designed space. But click any entry, and the area below the list lights up. The app assigns a color to each base station in the list, which is useful in the visualizations.
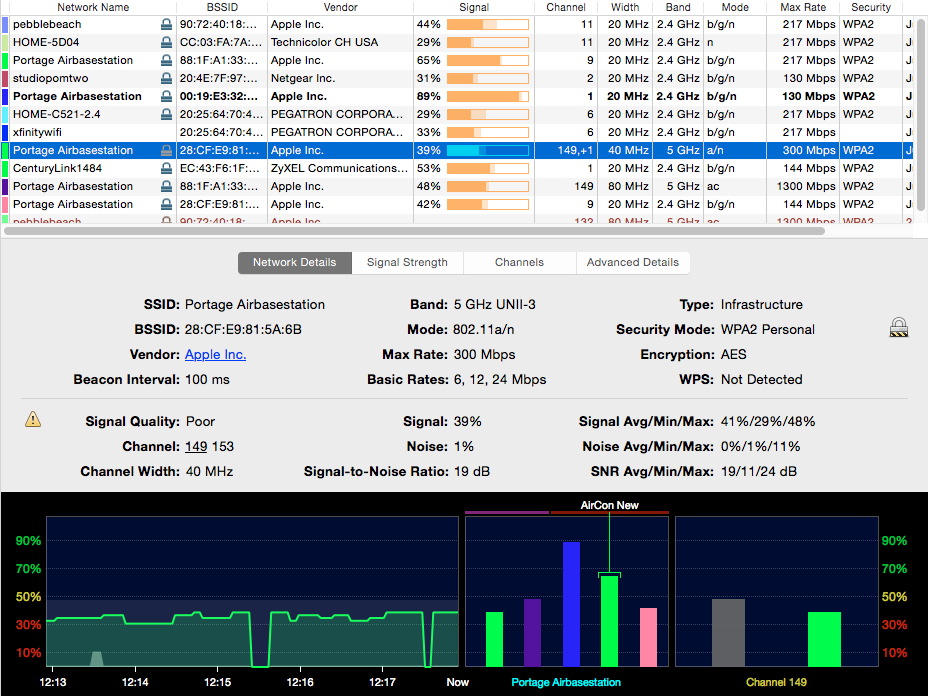
In the Network Details view, selecting any base station shows a rundown of technical details specific to that base station, and at the left a continuously updated scan of network quality, which can be viewed as signal, signal and noise, or signal-to-noise ratio. At the right, WiFi Explorer shows a color-coded bar based on signal strength of all other base stations using the same Wi-Fi channel.
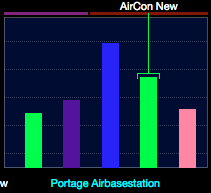
If multiple base stations use the same network name (or SSID, Service Set Identifier), selecting any one of them adds a display between signal strength and channel occupancy that shows each base station’s power on the same signal axis, split by frequency band (2.4 GHz and 5 GHz). You can hover over any bar and WiFi Explorer shows its individual base station name. Click any bar, whether in the middle or right displays, and the base station is selected in the list at top. These collections of networks are shown under Service Set in the Results bar at left, too.
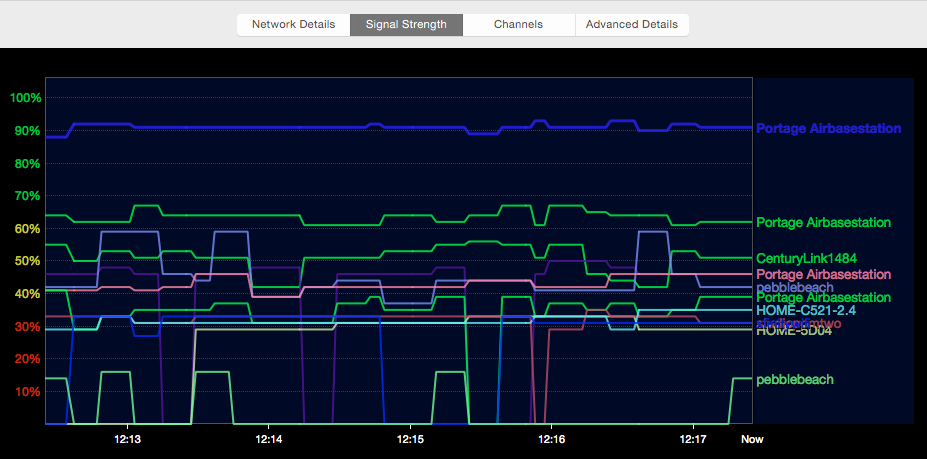
You can see an overlay of all networks’ signal strengths by clicking the Signal Strength button. Selecting one or more items in the list fills in the color below the line in the graph to make them more visible.
Note that this view doesn’t show network throughput, which would require software installed in different devices to check the link between them; this is just the capability of a Wi-Fi network to work within the parameters of a given network speed. The Max Rate column in the access point list shows you the current data rate at which a device is operating. Access points drop through a large combination of modulations and channel uses between the lowest and highest data rates; the higher the
data rate, the closer your computer running WiFi Explorer is to the base station while being unimpeded by other networks spreading signal over the same space.
The Channels view is remarkable. It shows how different base stations are occupying swaths of frequencies. In 2.4 GHz, you can see where networks overlap. Channels 1, 6, and 11 are considered non-overlapping — the central frequency for each channel is offset by 25 MHz, or more than a full channel.
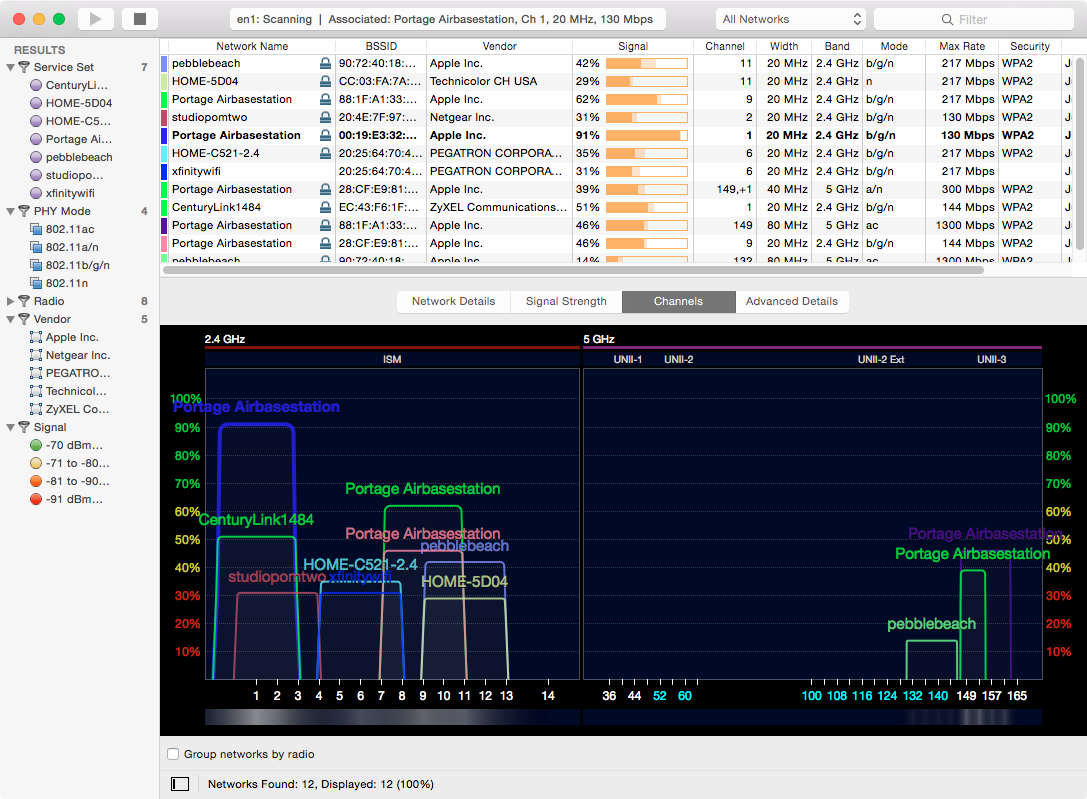
However, I’ve been told by IT professionals that one of the nastiest problems with Wi-Fi interference in 2.4 GHz networking comes from devices that are preset to use other channels, which includes some portable hotspots. Two networks on overlapping channels can try to avoid each other without losing too much throughput. But networks on adjacent channels (like channels 1 and 2) have to employ different, less-efficient mechanisms to overcome interference, which can dramatically reduce the amount of data that
gets through or cause inconsistent performance.
In the 5 GHz range, things are more civilized: base stations can only occupy channels exactly 20 MHz apart. With 802.11n, a Wi-Fi access point can span two channels (40 MHz), if there’s no detectable use on the extended portion; 802.11ac can grab a whopping 80 MHz. Each doubling of channel width doubles the effective top throughput rate, too. (WiFi Explorer shows all 5 GHz bands, which includes the little-used UNII-2 and UNII-2 Extended bands. For obscure reasons, few consumer base stations allow their selection; read “Improve Wi-Fi Performance in the 5 GHz Band,” 14 December 2009, if you’re interested. WiFi Explorer lets you suppress them in this view via Preferences > Hide DFS
Channels If No Networks Are Using Them.)
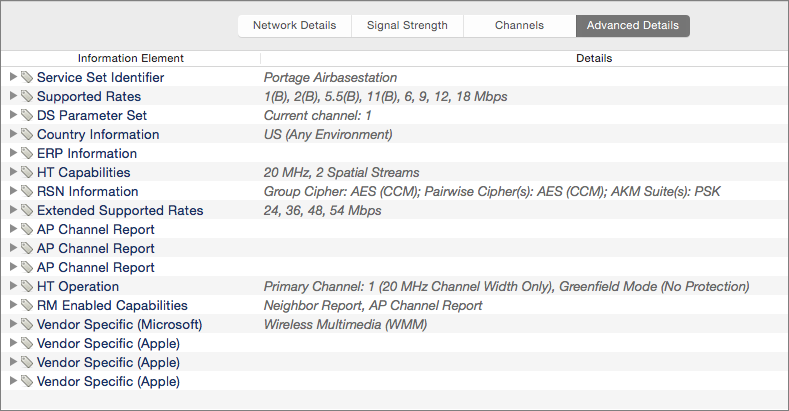
Finally, an Advanced Details view gives access to an incredible amount of minutiae that a wireless guru might love, or a home network installer might be delighted to have when troubleshooting a problem.
The signal strength information is gathered over time, and clicking the stop button or quitting the app results in a prompt to save the results. The data is stored in a static snapshot that you can re-open in WiFi Explorer to review later, whether offline or to compare with current network environment details.
Acting on this Practical Information — Netspot and WiFi Explorer provide a whole lot of information. But how can you turn a map and scanning into something you can act on to sort out interference or improve placement?
The NetSpot map should help you figure out whether your problems are purely related to a signal strength or if interference is at fault. For a signal problem, you’ll see your base stations showing cyan or blue or no coverage at all. Take WiFi Explorer to these locations and monitor what’s going on with your networks and those in the vicinity to see what the signal strength is across networks, including those run by other households, and the max rate for your networks, which can help you sort out if your network is being drowned out by other networks on the same or adjacent channels in a given band.
(Critical side note: all this may work for a while, but most base stations are designed to select a channel automatically every time they’re restarted intentionally, through a power outage, or by someone unplugging it and plugging it back in for whatever reason. This means that your own channel selections may suddenly disappear. And of course, you have no control over what your neighbors may do with their base stations.)
Once you have a longer analysis of each point, you can try one or more of the following and then re-test in NetSpot and drill down in WiFi Explorer to see what happens:
- Make sure your 5 GHz network is using channel 149 or higher (called UNII-3, to be technical); you can use WiFi Explorer to determine that, as well as any overlaps. If it’s using a lower-band channel (UNII-1), the base station may be using as little as five percent of the power allowed for an upper-band channel! This is a common problem, although Apple’s automatic channel selection will almost always pick channel 149 or above. (802.11n can manage its fastest 5 GHz rates with 149 or 157; 802.11ac winds up using 149 so it can span 80 MHz when it can clearly do so.)
- Remove obstacles to your Wi-Fi signal. Is your partner or roommate regularly camped out in a big stuffed chair in front of a base station on the floor? 802.11n and 802.11ac both use reflection as one way to improve throughput, but they aren’t as good as Superman at seeing through objects. Wi-Fi isn’t purely line of sight, but anything in the line of sight can reduce a network’s throughput and consistency. (People absorb 2.4 GHz very efficiently.)
-
Reposition your base station(s) and rescan to see if the new locations better overlap where you need signal. This may involve drilling holes to route Ethernet cables or using powerline networking — high-throughput versions with a raw rating of 1200 Mbps are now available — to pass a broadband connection through brick walls or ones you can’t drill in a rental (for more on powerline networking, see “Trading In-Home Wi-Fi for Powerline Networking,” 9 July 2007).
-
Add a base station. This is often the best scenario, and you don’t need either an Apple model or an expensive one. As long as you connect to the main base station via Ethernet, not through Wi-Fi — which works reliably only among Apple-made devices — you could purchase any well-reviewed $50 base station. At $99, the AirPort Express isn’t cheap, but it’s a powerhouse.
If your network’s base stations are coming in loud and clear (green, yellow, or red) in NetSpot but you’re still having connection problems in those areas, use WiFi Explorer to sort out what’s happening on the interference and channel assignment side:
- It might seem counterintuitive, but you might switch to a lower-band channel to reduce power usage if you have plenty of signal strength and don’t want your network to extend into adjacent homes, offices, or apartments. (You might talk to your neighbors about doing the same thing.)
-
In the 2.4 GHz range, change channels to find an unoccupied swath. As noted, channels 1, 6, and 11 (in the United States) are considered the ideal spread, but you might have to chart out different territory if channel usage is clumped around one part of the band.
-
Does the entire frequency map fritz out from time to time for seconds or longer? Someone may be running competing 2.4 GHz devices — which can include ham radios, ham television (yes, it exists), microwave ovens, badly designed video baby monitors, and industrial sealers. In the 5 GHz band, the most likely culprit is an older cordless phone. All of these can drive you to distraction because they may make your Wi-Fi network function intermittently. In 5 GHz, you can pick other channels, subject to the power limits noted above; in 2.4 GHz, you may be out of luck if you’re seeing garbage across all channels.
It’s a Wi-, Wi-, Wi-Fi World — Wireless networking isn’t rocket science. Well, it involves a lot of radio technology and calculations — okay, maybe it’s not far off from rocket science. But if you have your feet on the ground, you’ll appreciate any set of tools that let you survey the invisible world around you.
Pairing WiFi Explorer with NetSpot gives you effective insight into what’s happening with your Wi-Fi network and those legally making an incursion into the public airwaves through which you also broadcast. With their visualizations, you might be able to fix persistent problems and reduce dropouts.
I have WiFi Explorer and love it! It helped me to solve the WiFi problems in my house. After using it for awhile I bought a Netgear N300 WiFi Range Extender Model WN3000RP for about $40, and it cleared up the problems I had with my iMac dropping signals. My only complaint is that it runs only on a Mac. I have an iMac which is not suitable for dragging around the house. I also have an iPhone and my wife has an iPad. Why don't they make a iPhone version? Does anyone know another product this good for the iPhone? I have hunted on the App Store with no success.
I've been well-equipped with just NetSpot for my home WIFi improvement project, and it did the amazing job, all you may be looking for in WiFi Explorer app is already in NetSpot's Discover mode, so you might save $15 and get a speed boost not spending an extra penny. Other than that, it's an unbelievably helpful article. Thanks
Your advice: Make sure your 5 GHz network is using channel 149 or higher.
My Apple Airport (automatically) assigned channel 34 in the 5GHz band. I apparently have two neighbors running in the higher band - one network channel 149 and two (same neighbor, apparently) running on channel 153 (one of these networks is a "guest" network.) My own 5 GHz network runs fine with no performance problems. The Air Port is upstairs and my two upstairs iMacs use the 5 GHz channel. Downstairs, my MBA uses the 2.4 GHZ Channel 11 (I have other non-Mac devices using this channel.)
Everything seems to run fine, and I have chosen to ignore your advice about using the UNI-3 channels. Is that a mistake?
David
No, that advice is in the troubleshooting section. If you're not having trouble, don't shoot it.