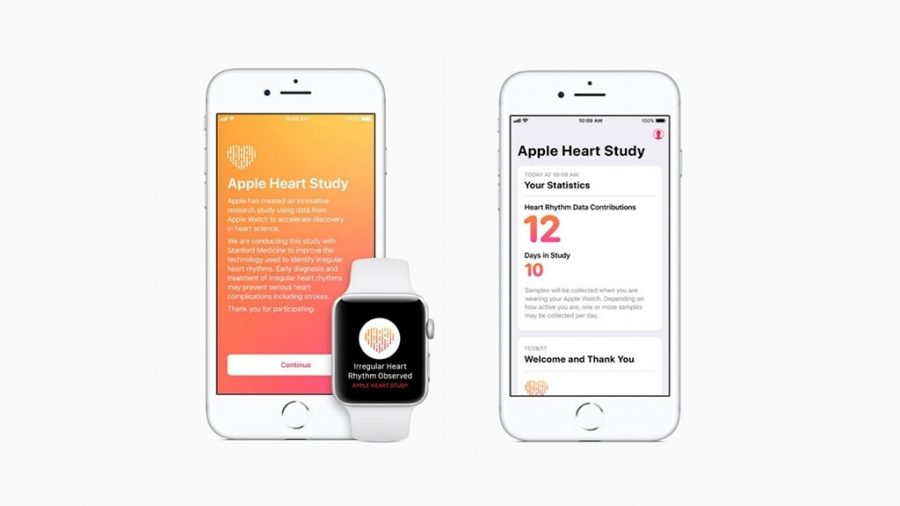
Stanford Medicine and Apple have announced the results of the massive Apple Heart Study, which tracked 400,000 users of the Apple Watch (Series 1, 2, and 3, but not 4) to determine if an app could use data from the watch’s heart-rate sensor to identify atrial fibrillation (AFib). If the app detected an irregular pulse, it notified the user, who was asked to schedule a telemedicine consultation with a doctor. After that, the user was provided with an ambulatory ECG patch to confirm future Apple Watch readings.
The results sound good—just 0.5% of participants received any notifications at all, and of those who did, 84% were found to be in AFib at the time of the notification. Only 34% of those who used the ECG patch were found to have AFib, a finding that the study authors say is unsurprising, given the intermittent nature of AFib.
In some ways, the study is more interesting for how it was able to gather data quickly from a large number of participants via wearable technology than for the actual results. Such techniques could vastly speed up certain types of medical research. (If you’re worried about AFib, you should be using the ECG sensor on an Apple Watch Series 4—see “I’m a Paramedic: Here’s How the Apple Watch Series 4 Will and Won’t Save Lives,” 3 October 2018.)
The study says the algorithm has a 71% positive predictive value, while 84% of those who triggered a notification actually had aFib. Am I the only one confused by that? What does “positive predictive value” mean if not having the condition when the algorithm says you do?
A good question, and one I had too. Maybe @ron has some insight into the medical-speak.
I can’t locate anything beyond the report linked to (it’s not published yet in a peer-reviewed journal, I assume), so I’m just speculating here. Sometimes PPVs are corrected/normalized if the population that is sampled differs from the larger population. So the 84% would represent the “raw data” from this study, but the 71% would represent a conservative estimate of the value for a more representative sample.
I have no idea if this is why the numbers differ in this instance – I’m just speculating from general statistical knowledge without seeing the underlying data. It does seem a rather large correction, if this is why they differ.
I assume “positive predictive value” would encompass identifying people who have the condition but also identifying those who do not.
PPV is the probability that a person with a positive test result DOES actually have the condition. The negative test results are ignored in this calculation.
NPV is the probability that a person with a negative test result does NOT actually have the condition.
I am not sure why the PPV in the Apple study is 71% and not 84%, but if the investigators had reason to believe that the sample in the Apple heart study was not reflective of the population as a whole, they could have applied a correction to normalize their results to the broader population.
It could also be poor wording in the summary. We’d need to see a more detailed explanation to really know.
The positive predictive value (PPV) of a test is the probability that someone who returns a positive value for the test actually has the condition.
Example: assume a condition with a prevalence in the sample population of 1 in 200. Apply a test which has a sensitivity of 99% (that is, if someone has the condition, there’s a 99% chance that the result will be positive) and a specificity of 98% (that is, a 98% chance that if someone doesn’t have the condition, the test will be negative).
The result is positive. What is the chance that the person has the condition?
Answer: 20%, near as dammit.
Why? Assume a representative sample of 200 people.
One has the condition. Given a 99% sensitivity, it’s close to certain that she will return a positive result.
199 don’t have the condition. 2% (100-98) will return false positive results; that’s 4.
So there will be 5 positive results, of which 1 will be a true positive. The PPV of that test, applied to that population is 20%.
The key point is that while sensitivity and specificity are characteristics of the test, PPV (and its converse, negative predictive value) are functions of the test and the population to which it’s applied. If the condition’s prevalence in the sample population were 1:1000, the PPV of the test falls to less than 5% (21 positive tests, one true).
This is why specificity is at least as important as sensitivity for a screening test.
Jeremy